If you are new to the topic of abatements, I recommend my tax abatement series here.
I’ve updated my 2015 long-term abatement map to include 2016 data. The map is provided below, along with reports showing underlying data grouped by project type (affordable housing vs. market) and by ward. Source data was derived from the city’s user friendly budgets and abatement documents from the tax office. These are all abatements currently paying “PILOT” fees into the respective year’s budget.
Key Insights
- The city increased the number of abatements from 146 in 2015 to 168 in 2016 (an 8% increase in abatement contracts). As a result, PILOT billings and assessed value of abated real estate in Jersey City also increased. This reveals the city’s increasing reliance on abatements to develop the city, as opposed to traditional development that adds to the tax base.
- The city has 50% more market rate abatements than affordable housing abatements. This reveals the city’s preference to drive tax subsidies towards market rate housing instead of affordable housing.
- Nearly 79% of market rate abatements are located in Ward E, revealing a striking subsidy bias to that ward at the expense of the other wards.
Map Legend & Methodology Notes
There is a one year lag in abatement reporting in NJ. So “2015 ” refers to the 2015 report containing 2014 data and “2016” refers to the 2016 report containing 2015 data.
The pin drops on the map are color-coded:
- Green Markers = Commercial/Industrial (market rate properties like residential rentals and condos, office buildings, industrial buildings, and hotels)
- Yellow Markers = Affordable Housing (the developer receives the abatement in exchange for building housing that is then offered at reduced rates)
- Blue Markers = Other (e.g. PATH properties)
There are six wards in Jersey City:
- Ward A: South Greenville (green-shaded area of the map)
- Ward B: West Side (red-shaded area of the map)
- Ward C: Journal Square (yellow-shaded area of the map)
- Ward D: the Heights (purple-shaded area of the map)
- Ward E: Downtown Waterfront (blue-shaded area of the map)
- Ward F: Bergen Lafayette / Bergen Hill / Greenville (orange-shaded area of the map)

Metrics
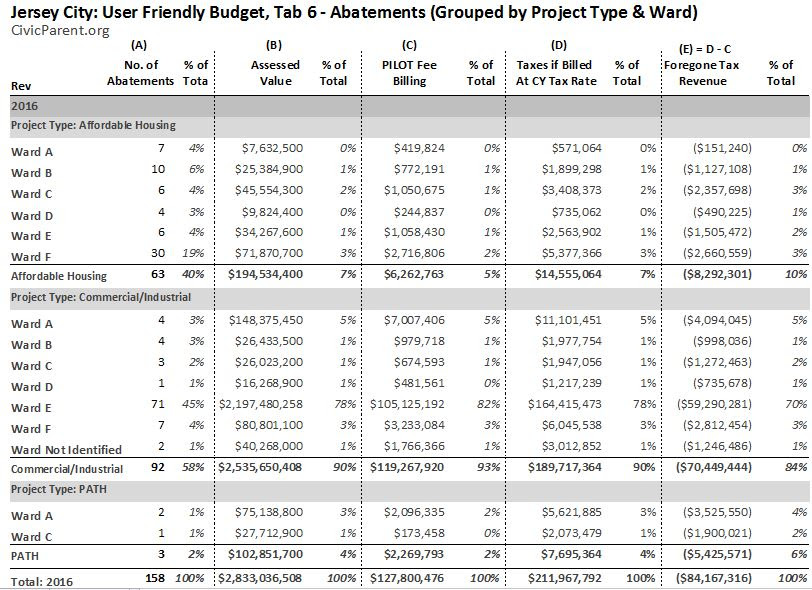
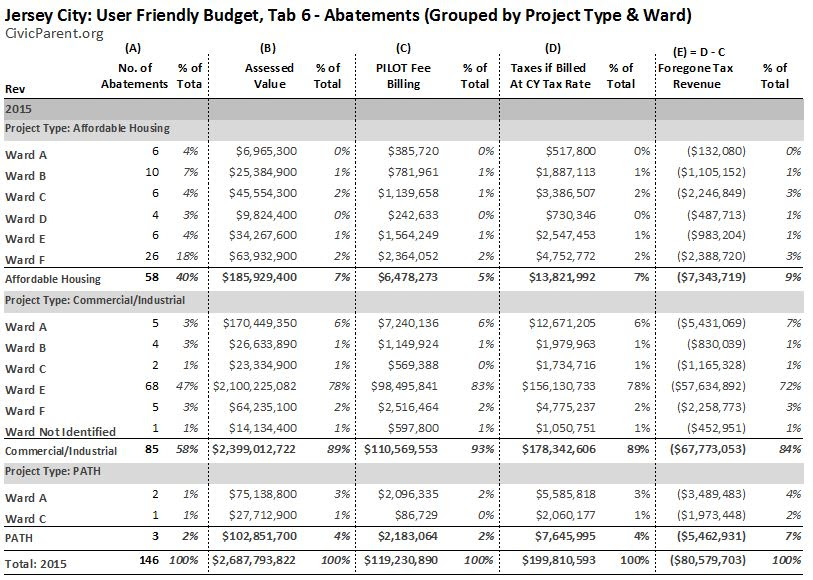
I’ve summarized the data underlying the map into two year-specific reports subtotaled by project type and ward. “Foregone tax revenue” is a computation I added to show the variance between “taxes if billed at the current year tax rate” and “PILOT billings.”
2015 Long-Term Abatement Data Summarized by Project Type and Ward:
2016 Long-Term Abatement Data Summarized by Project Type and Ward: